How to Model Traffic Gridlock Using NetLogo
Blog Barista: Tim Hollosy | August 1, 2019 | Developer Tools | Brew time: 8 min
Dropping my daughter off at school is always a challenge. Her elementary school has what is called the “car loop.” It’s where parents can safely drop their child off in the morning. The system is simple:
1. If there is room, pull into the drop off zone and let your child out.
2. When all of the cars in front of you are unloaded you may now pull forward.
This system prevents the possibility of a child being hurt. It’s also very slow. If you happen to be running a bit late because your child spent 15 minutes petting the cat instead of putting her shoes on, you’re in for a huge traffic jam going in and going out, which I suspected was because we only were unloading four kids at a time. I was commiserating about what a zoo it is to a client with a friend and she interrupted me and said, “every school is like that.” If every school has this issue then it’s really screaming for a solution.
What would a solution be? What would the optimal number of drop off spots be. We currently have room for four cars at a time. Would it be better to have 10? 20? At what point would it not make any sense to stop increasing the drop-off zone? There are even more confounding factors, like randomness. Ask an eight year old to get themselves out of their booster seat and grab their backpack. Sometimes it takes 5 seconds, sometimes it takes 45 seconds.
So if we look at our problem we have the following components:
- Independent agents making decisions (people in cars)
- Randomness (3rd graders)
- A set of simple rules that create unpredictable cascading effects (the dropoff zone rules)
This sounds an awful like a problem for complexity theory! Complexity theory has applications in nearly every field. There are many definitions of complex systems, but simply put by Dr. Luis M. Rocha, it is “any system featuring a large number of interacting components (agents, processes, etc.) whose aggregate activity is nonlinear (not derivable from the summation of the activity of individual components) and typically exhibits hierarchical self-organization under selective pressures.”
Traffic is a classic example of a complex system, each person in each car is making their own decisions and the combined behavior affects the whole system, creating a feedback loop. We’re all aware of the strangeness of traffic behavior, for example one person driving too slow can cause a traffic jam and trigger other strange effects. Well, one night I fell down the YouTube rabbit hole while eating cereal at the kitchen table at midnight and I came across a video of a complexity theory lecture talking about building complex geometries with very few lines of code in a funny looking program called NetLogo.
I looked up NetLogo and saw that it was a programming language and tool for modeling agent based systems. The syntax is quite strange, but really fun. For instance, with just a little bit of code you can model many things! All the examples below show the diversity of this modeling tool.
How Oil Percolates Through the Soil:
How Fairy Rings Grow:
How Bees Swarm to Find New Hives:
All with a shockingly small amount of code. The small amount of code demonstrates the principle that biologists already know. Very simple rules can create very complex behavior. You can browse models and see NetLogo in action with NetLogo Web right in your browser, so check out the Model Library and have fun playing around.
We’ve established that we have a well defined problem and that NetLogo is a tool we can use to build a model and explore the problem. How can we model a traffic system with cars dropping people off? It turns out, it’s very simple. I started with a basic traffic model from the Models Library in NetLogo. The model is called “Realistic Single Lane Traffic Flow,” here’s how the author, Ian J Heath, describes it:
“This models the flow of traffic on a single-carriageway. It is different from other models in that the “car following” rules are simple, realistic and could mirror actual driving practices. Acceleration/deceleration is smooth and within comfortably achievable bounds for the average car. Each car adjusts its headway-secs (i.e. the number of seconds it is behind the car-ahead when passing a fixed point) towards its desired tailgate-secs (i.e. the target headway-secs that that an individual driver prefers). A realistically achievable hard braking is applied whenever there is a chance of shunting the car-ahead. The road is effectively a continuous loop, as the world wraps. The model demonstrates how wave-like traffic congestion forms, even without any accidents or road works.”
Let’s modify this model to simulate the dreaded car loop. First, we should understand how the model works. In NetLogo every model comes with the same basic information. Here’s what this model says about itself:
“This model models the movement of cars on a highway. Each car follows a simple set of rules: it slows down (decelerates) if it sees a car close ahead, and speeds up (accelerates) if it doesn’t see a car ahead. The model extends the Traffic Basic model, from the social science section of the NetLogo models library, by having cars adapt their acceleration to try and maintain a smooth flow of traffic.”
Every model has three concepts:
1. Patches: the grid that represents the environment.
2. Agents: the default agent is a turtle, these can move around the environment and interact with it and other agents.
3. Observer: the observer can ask the environment (patches) and agents to do things.
I made a few modifications to the model because I wanted to be able to visually see the drop-off zone in yellow. I didn’t want the cars to wrap around the map, creating a traffic jam scenario that would prevent us from analyzing the rate of kids exiting cars.
After this, I just needed to code the logic for cars dropping off kids. This is really the fun part of working with NetLogo. The syntax is very expressive and you can think things through like you would in real life.
Here’s my dropoff function:
to dropoff
  ifelse (not unloaded and [pcolor] of patch-ahead 1 = grey) ;;if you're at the front of the line (grey patch in front) then unload
         or (not unloaded and speed < 3) ;;if you are stopped and you haven't unloaded then unload
          or (gettingout AND speed < 3) ;;if you're unloading, continue that.
  [getoutkid]
  [follow-car]
end
To give this function some context, it’s called whenever an agent (car) is on a yellow patch.
If the next patch is grey then unload. If you’re stopped and you haven’t unloaded then unload. If your kid is in the process of getting out of the car then stay stopped, otherwise you just follow the car ahead of you.
To add randomness whenever a car is created it sets a counter with a random number between 30 and 120 “ticks.” If you run this model at a normal speed, it works out to each kid taking between 5 and 10 seconds to get out of the car. Each car has a label where the counter value will be displayed so we can make sure it’s working.
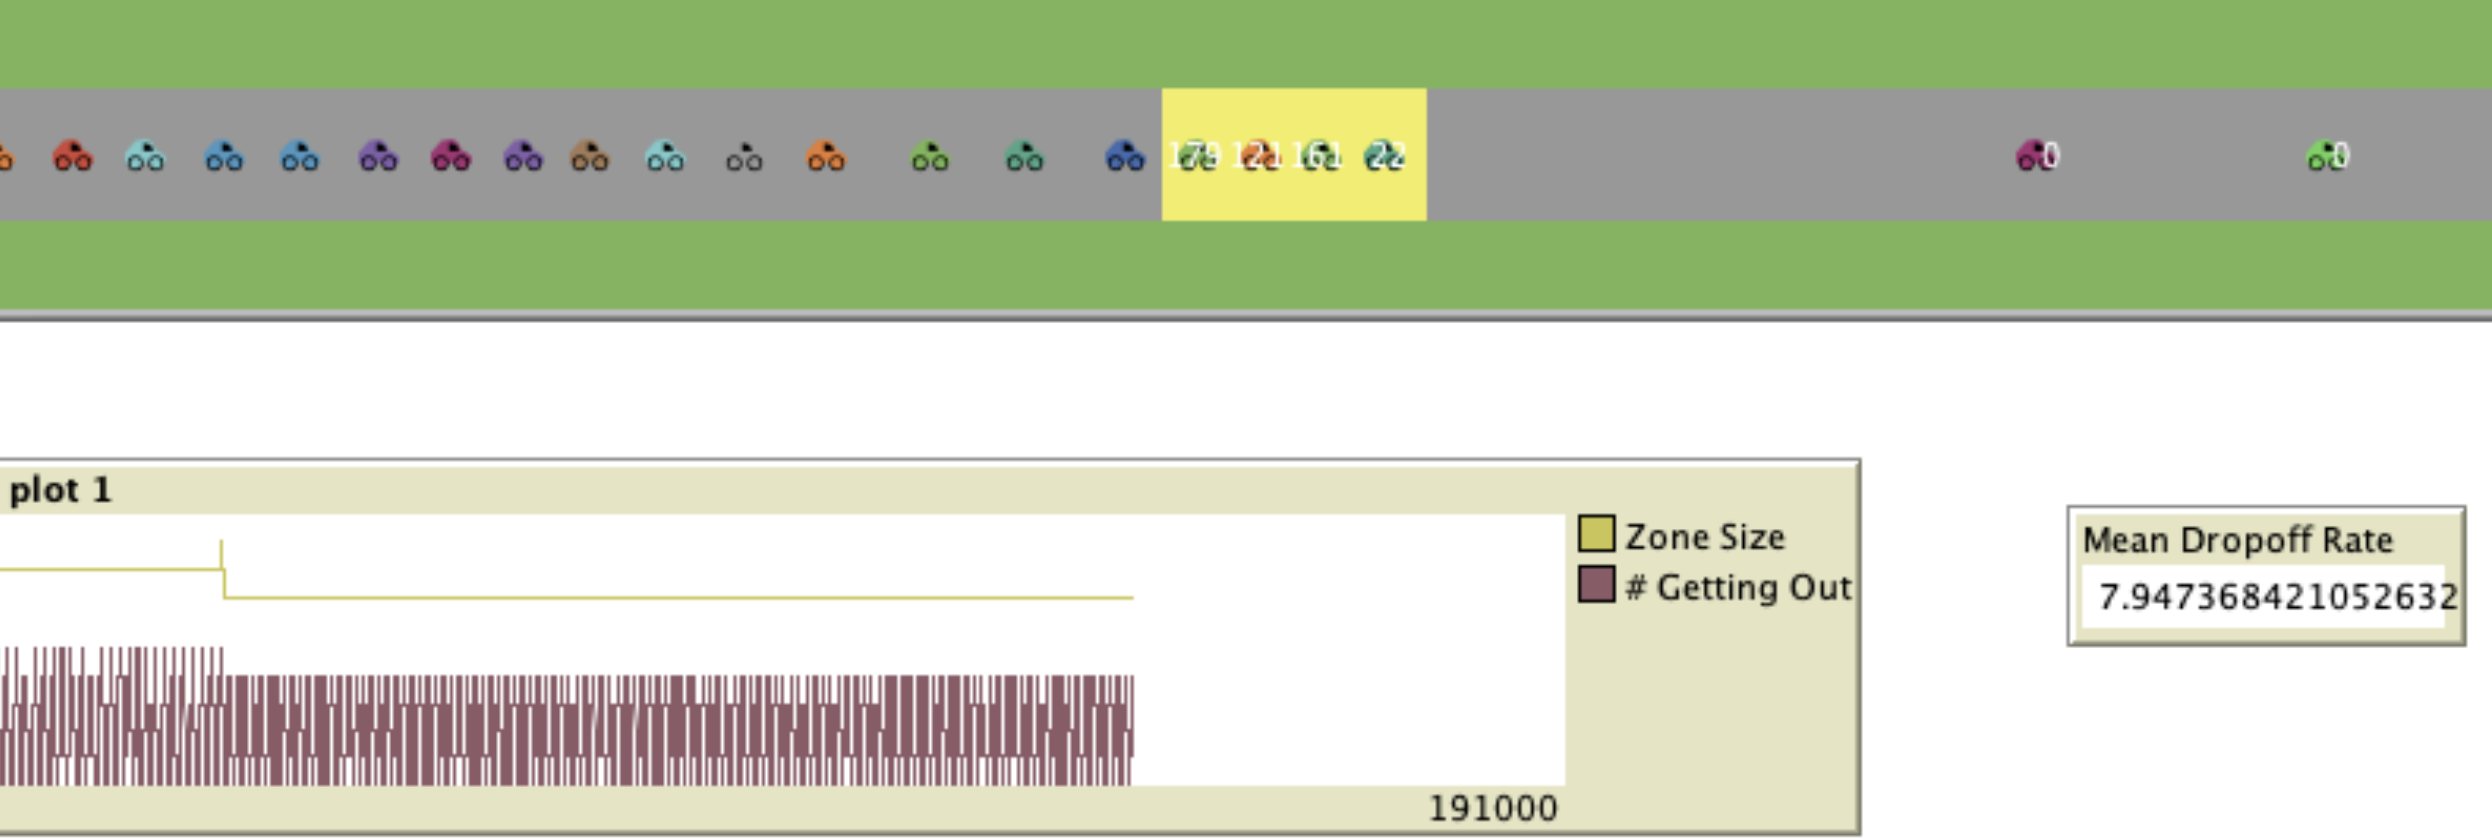
I added some plots and sliders so we can adjust the size of the dropoff zone and see how that affects the rate at which kids are unloaded. Here’s a video showing the model running in NetLogo:
Results

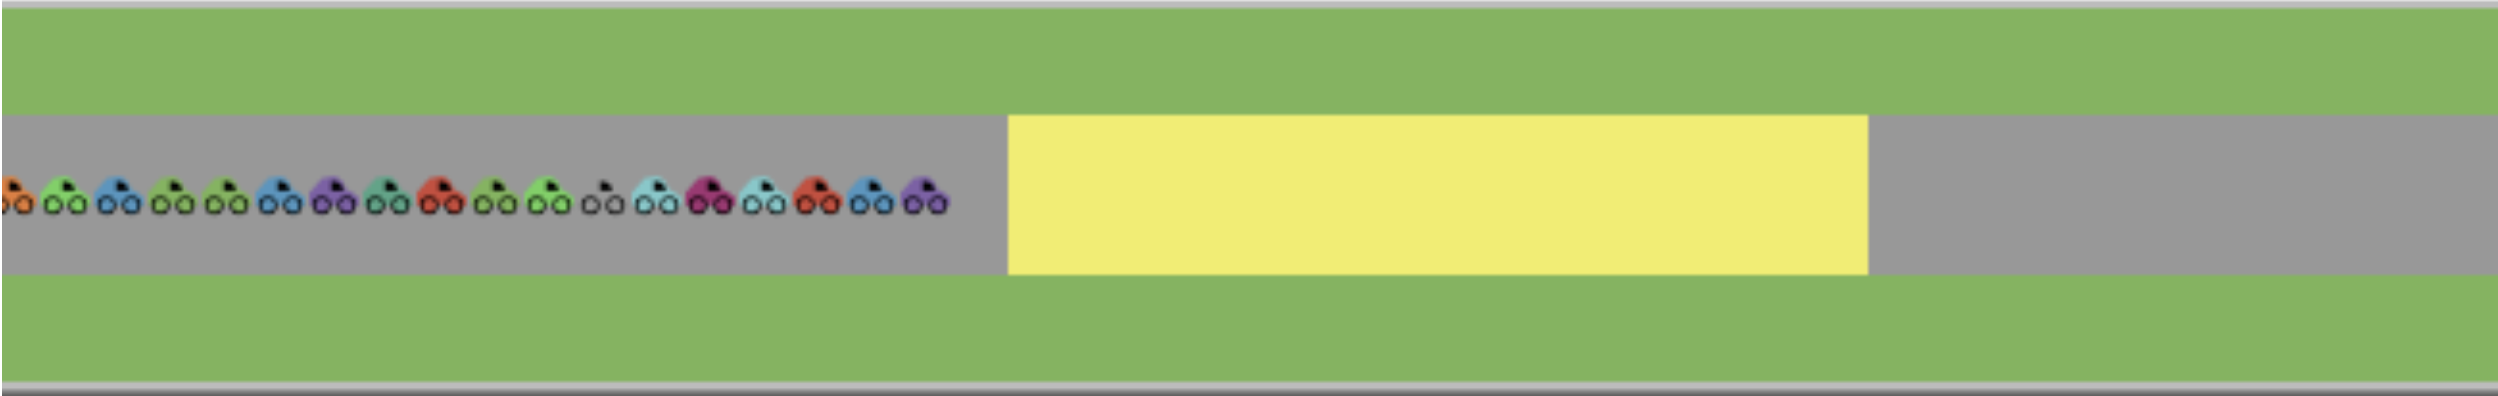
Zone Size: 7
Dropoff Rate: ~8
Here, we can see that with the zone size set at 7 (which fits about 4 cars, the same as my daughter’s school) and the mean dropoff rate is approximately 8.
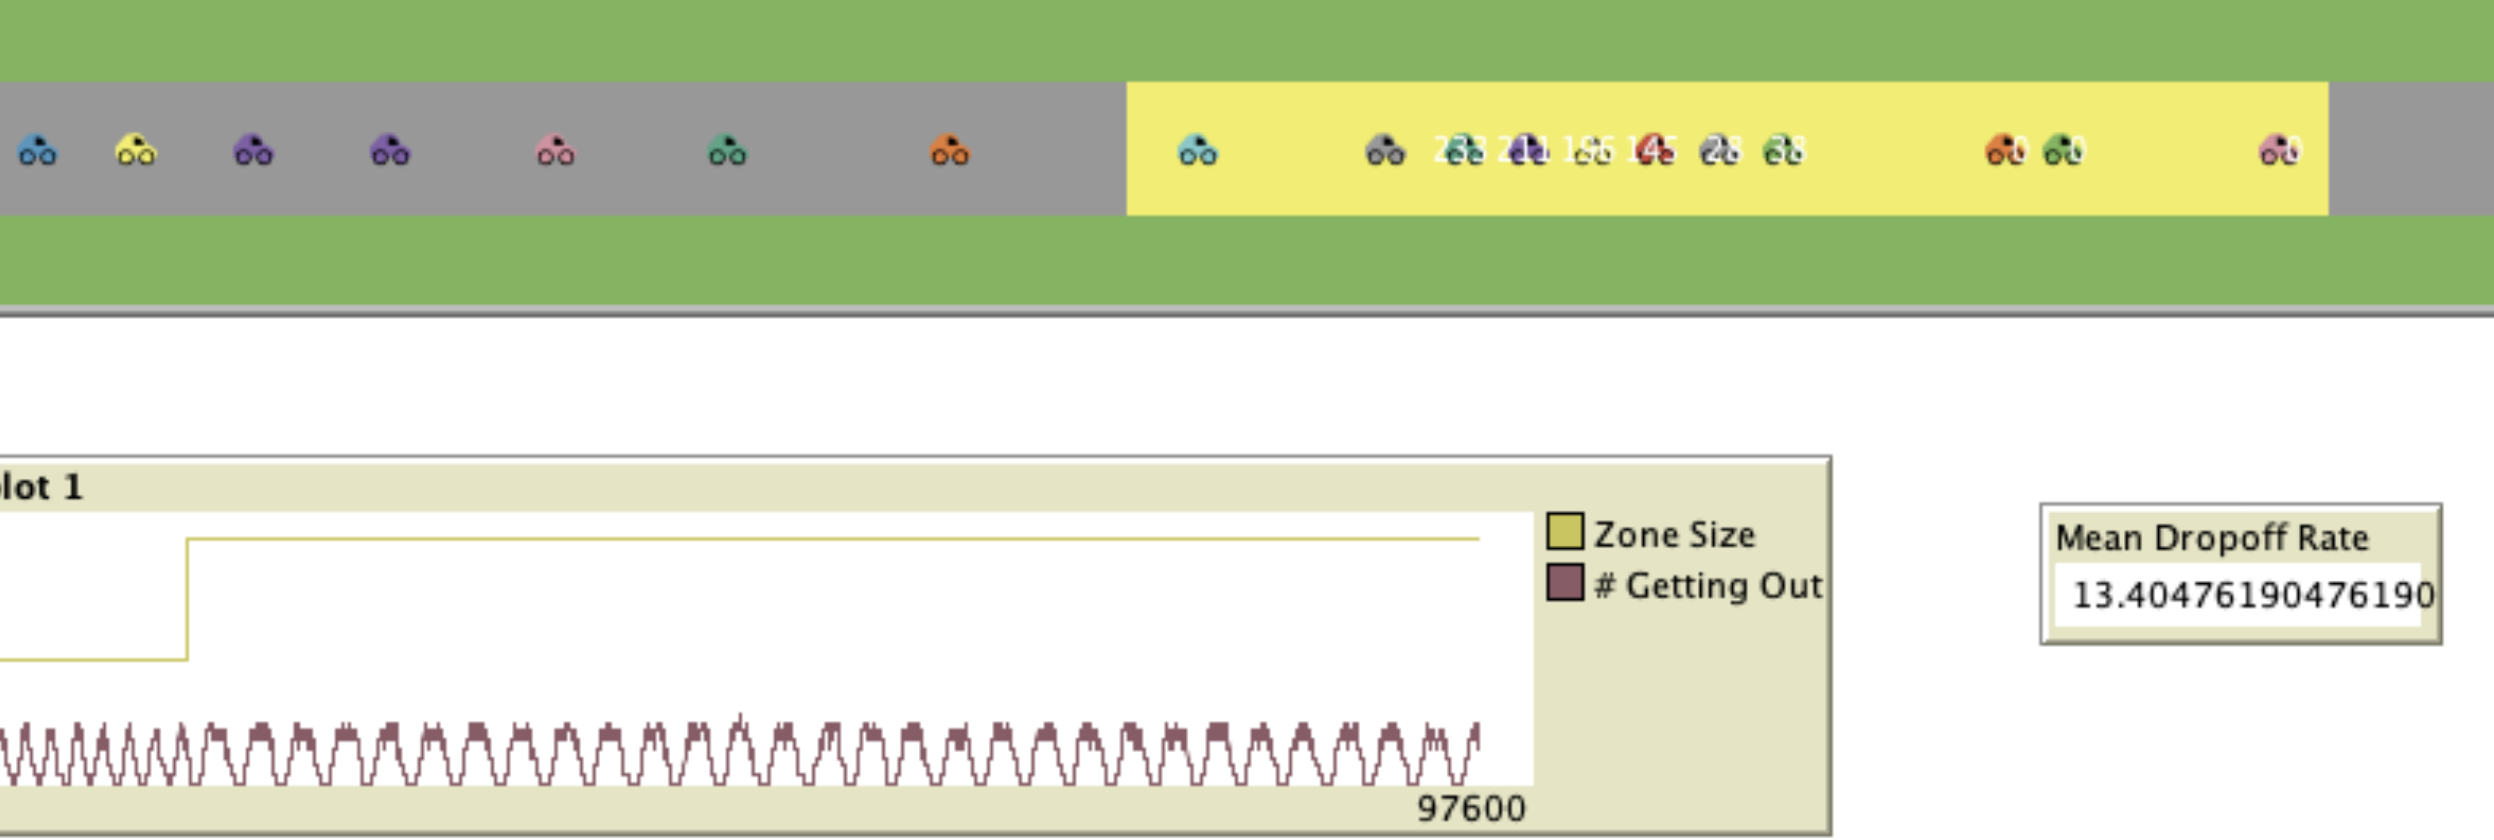
What if we double the zone size to 14, will the dropoff rate double?
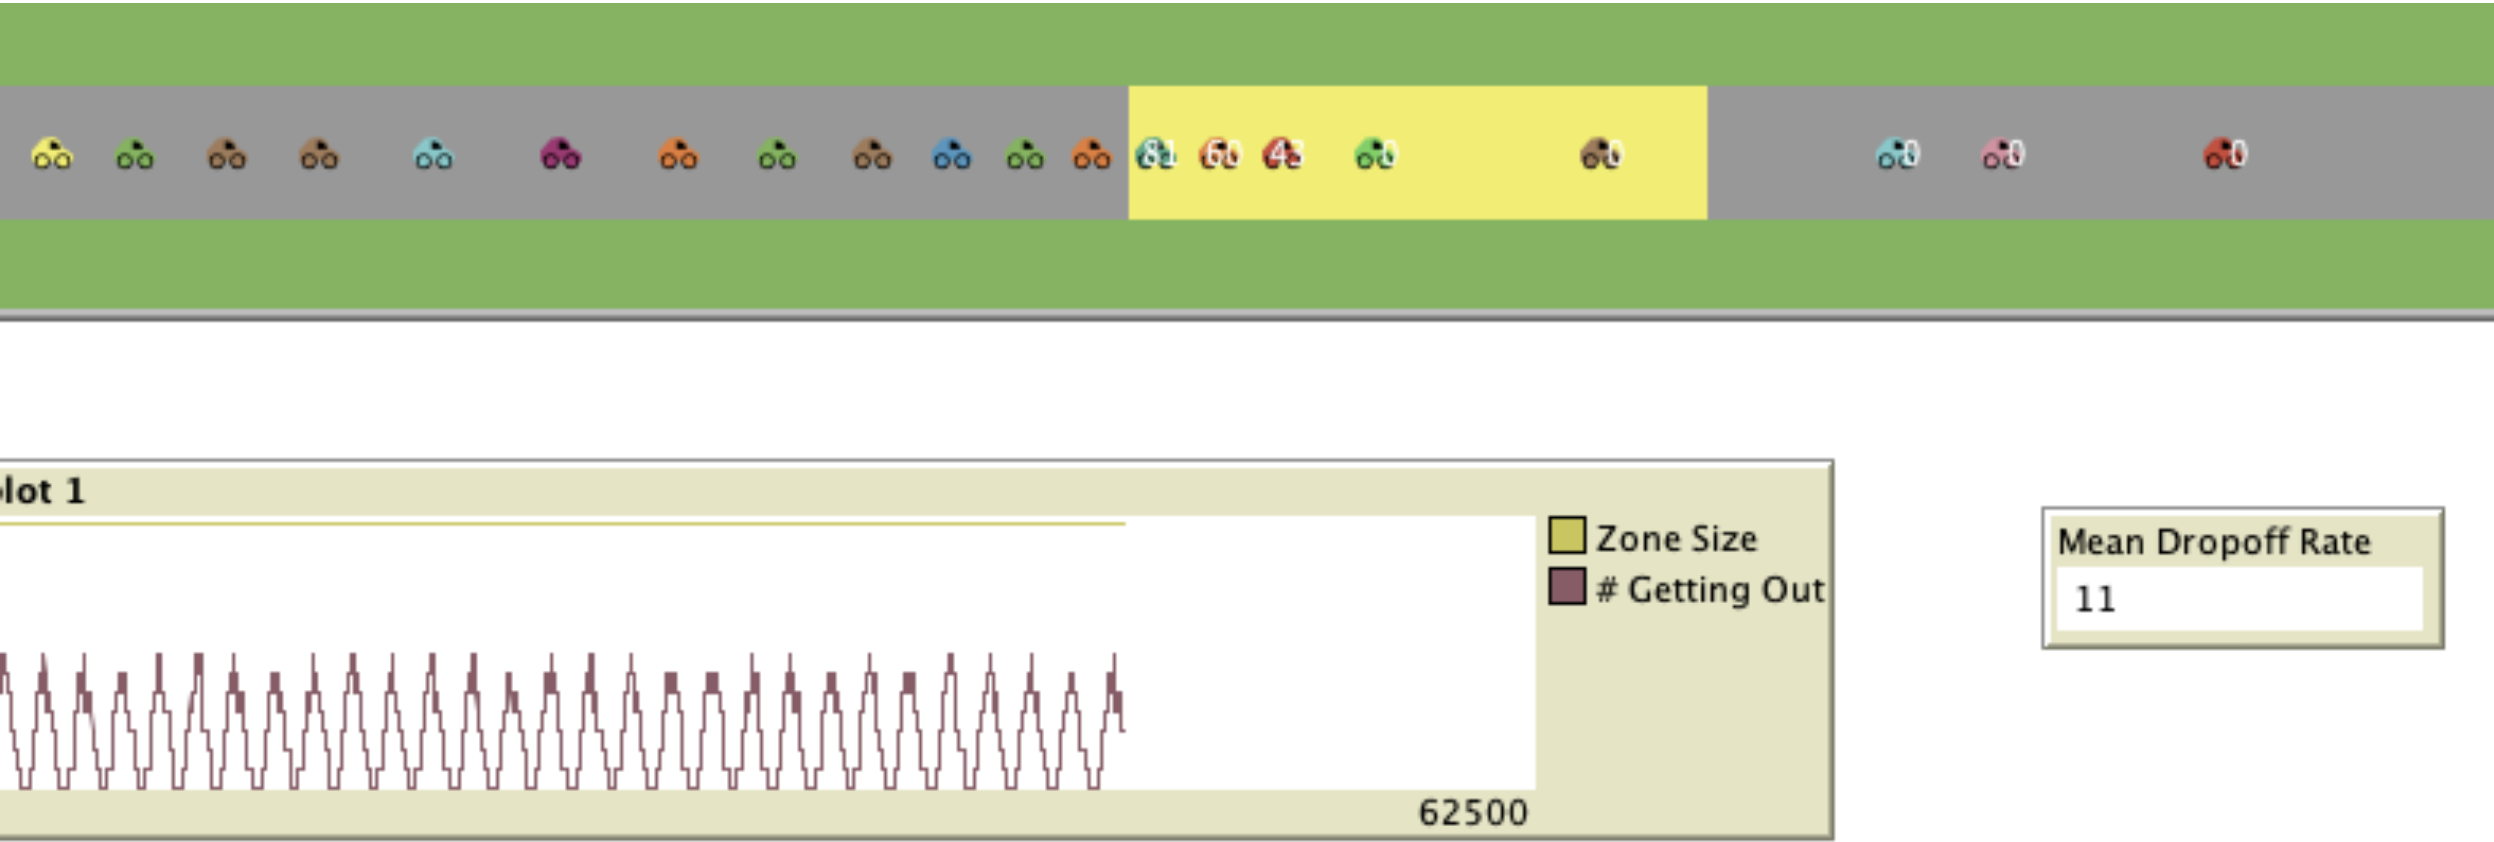
Zone Size: 14
Dropoff Rate: 11
So, the dropoff rate did not double, but it did increase. We can also see more clearly how the number of kids currently getting out of a car oscillates as cars enter the zone and line up to drop off their kids. What if we double it again, will it increase by the same rate? If so, then we have a linear relationship; if not, we have a nonlinear relationship.
Zone Size: 28
Dropoff Rate: 13
It increased, but not by as much. I ran some more runs across millions of ticks and got these results, check it out below!
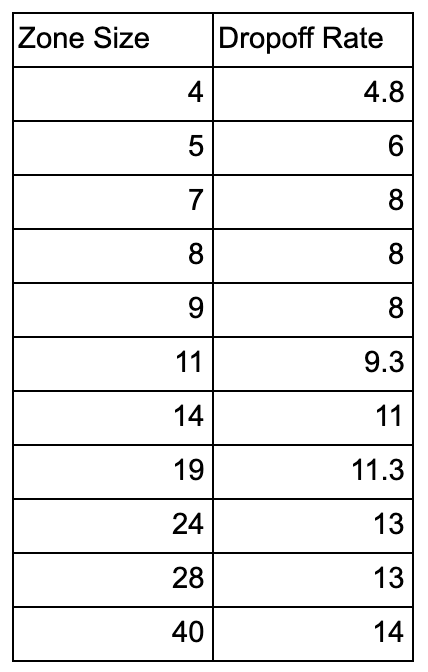
If we plot them, we can see there’s a logarithmic fit.
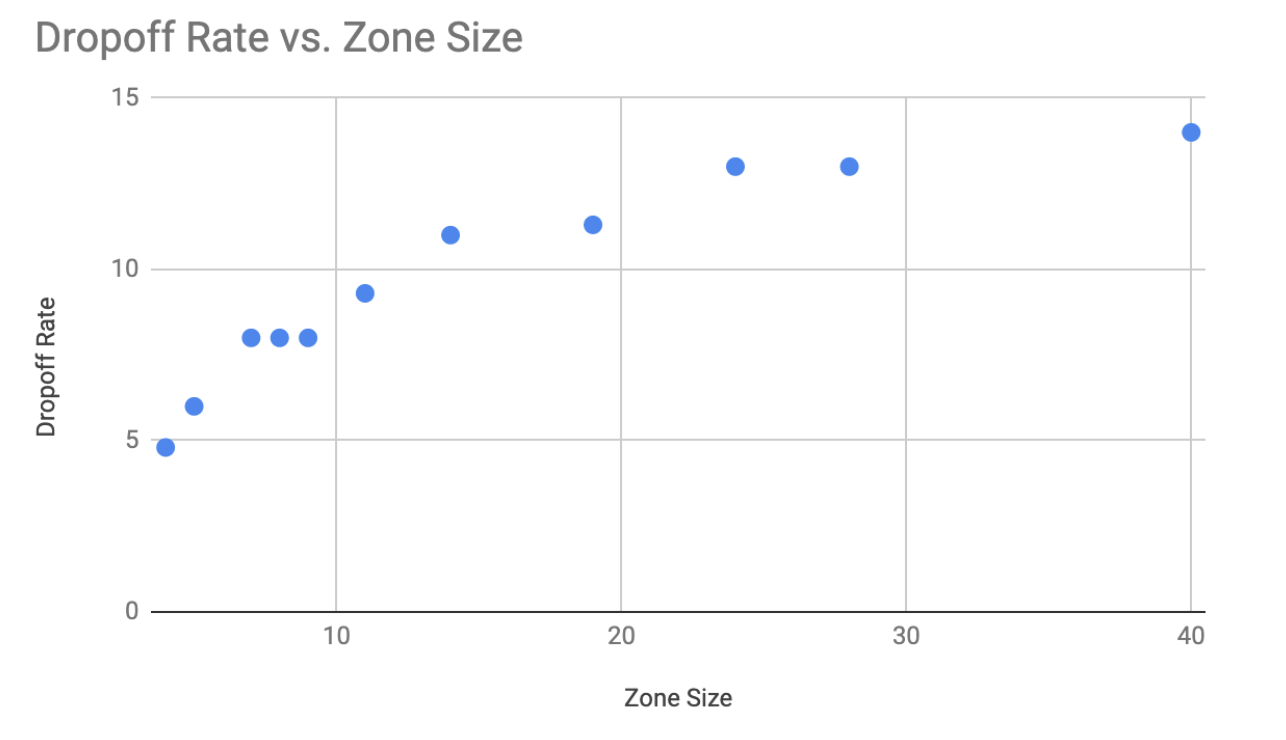
Findings
So, what conclusions can we draw from this model? There appears to be diminishing returns as we take up more space for our drop off zone. It also looks like the optimal dropoff zone size is about 8 patches, which allows 4 cars to drop off at once.
Zone Size: 7
Dropoff Rate: ~8
This means my daughter’s elementary school already has the optimal dropoff zone size! Of course all these findings are contingent on the model being correct. There are many factors that influence the rate of dropoff including the braking rate, speed limit, etc. which could be tweaked and possibly yield different results.
The ability to create models so easily to simulate dynamic systems with independent agents can be very powerful. There are many applications where developing models could help us visualize how our design decisions in software may impact users. What if we developed a model that simulated how our workflow system assigned tasks? Or how users socially interact with each other inside of a web application? Creating models in NetLogo is simple to learn and helps us uncover our cognitive biases. We’re wired to think in cause and effect, however without models we can’t intuitively understand cause and effect in dynamical systems. I hope that more software engineers will add NetLogo to their toolbox as we design systems that interact with the increasingly fuzzy real world.
You can download the model here, and use it with NetLogo desktop or upload to the NetLogo web application where you can play with or modify the code.
Other recent posts:

Kunz, Leigh and Associates (KL&A) Announces the Retirement of KL&A Co-Founder John Leigh
OKEMOS, MI, April 11, 2023 – Kunz, Leigh and Associates (KL&A) announces the recent retirement of KL&A Co-Founder John Leigh as of March 31, 2023. Mr. Leigh began his career as a developer working on large mainframe systems before moving…

Team Building in a Remote Environment
Blog Barista: Dana Graham | June 15th, 2022 | Culture | Brew time: 5 min
Let me start by saying I don’t care for the term “work family.” I have a family I love, and they have absolutely nothing to do with my career. I want my work life to be its own entity. I like boundaries (and the George Costanza Worlds Theory). Certainly, I want to enjoy and trust my coworkers, and I want to feel supported and cared for…
0 Comments